ADVERTISEMENT
ADVERTISEMENT



USCIS backlog surges to 11.3 million pending cases
Denial rates increased across many immigration applications and petitions.
-
1759953093.png) Staff Reporter
Staff Reporter - Fri, 07, Aug 2026
- 05:12 EDT
- 27
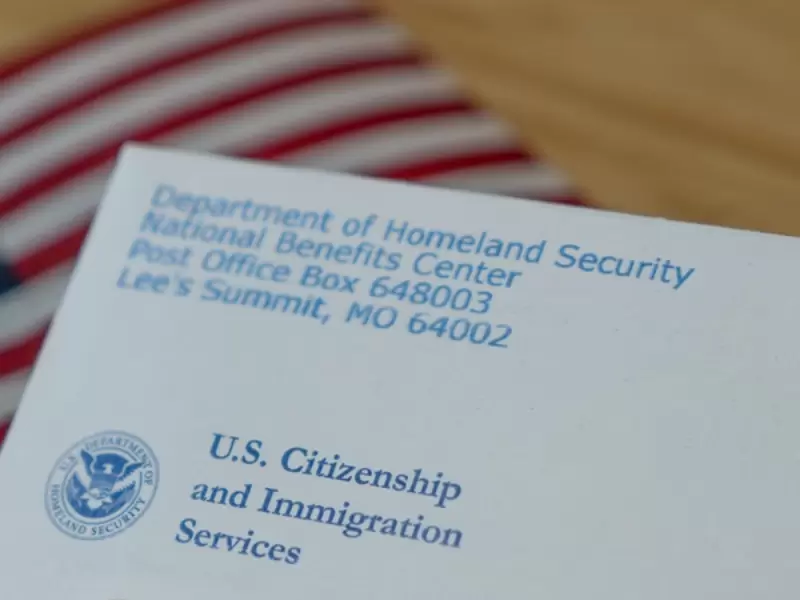 USCIS / AMERICAN IMMIGRATION COUNCIL
The U.S. Citizenship and Immigration Services (USCIS) backlog remains historically high, with the number of pending applications and petitions surging to 11.3 million, according to the latest data from the American Immigration Council.
The updated data for fiscal year 2026 show a broad slowdown in immigration processing, with fewer applications being processed, persistently large backlogs, rising denial rates and substantially longer wait times for decisions, the council said on Aug. 5.
ALSO READ: USCIS announces big change to policy on RFE and NOID
The USCIS backlog remains historically high. Between FY2025 Q1 and FY2026 Q1, the number of pending cases increased by more than 1.6 million, or 16.5%, rising from 9.7 million to 11.3 million applications and petitions, according to the data.
The American Immigration Council is a nonprofit organization founded in 1987 and headquartered in Washington, D.C. It works to strengthen the U.S. immigration system through impact litigation, research, policy analysis and storytelling to promote fairness, justice and inclusion.
At the same time, USCIS processed substantially fewer immigration petitions than it did a year ago. In FY2026 Q1, the agency received 33.6% fewer applications and completed 40.8% fewer cases than in FY2025 Q1, suggesting that immigrants and their petitioners may continue to face lengthy waits for decisions, even if filing volumes remain lower than in previous years, it said.
More importantly, USCIS completed fewer applications than it received in FY2026 Q1, making it the 11th consecutive quarter in which the efficiency ratio, calculated by dividing completions by receipts, remained below 1.
Although the increase was widespread across many immigration benefits, some categories experienced particularly large increases.
Among the major filing categories, employment authorization documents (EADs) experienced some of the largest increases in pending cases. The backlog for Form I-765 (Application for Employment Authorization) grew by 446,650 cases (38%).
Within that category, applications filed by beneficiaries with pending adjustment of status petitions nearly tripled, increasing from 154,469 pending cases in FY2025 Q1 to 461,884 in FY2026 Q1. USCIS received nearly the same number of applications in both quarters, 163,642 in FY2025 Q1 and 164,763 in FY2026 Q1, it said.
However, completions were almost cut in half, falling from 170,256 to just 86,756. As a result, the processing efficiency ratio declined from approximately 1.04 to 0.53, it added.
An even more dramatic example occurred among adjustment of status applications filed by refugees (Form I-485). Receipts increased from 16,725 to 25,746, while completions fell from 17,756 to just 3,536. The efficiency ratio dropped from 1.06 to 0.14, meaning the agency completed only about 14 applications for every 100 it received in that quarter.
Applicants are waiting substantially longer for decisions than they were a year ago. Across all USCIS forms, the average backlog clearance time nearly doubled, increasing from 9.4 months in FY2025 Q1 to 18.6 months in FY2026 Q1, it said.
The same trend appears when comparing calendar-year averages. Average backlog clearance time increased from 8.9 months in 2024 to 14.4 months in 2025, a 61.8% increase.
Some individual forms experienced even larger increases. The backlog clearance time for Form I-485 adjustment of status applications filed by asylees increased more than eightfold, rising from 7.7 months in FY2025 Q1 to 70.6 months in FY2026 Q1.
Denial rates increased across many immigration applications and petitions. Overall, the denial rate increased from 8.9% to 12.2%, suggesting immigrants are facing a more difficult adjudication environment than they were one year earlier.
Several employment-based immigration categories experienced particularly sharp increases in denials. Overall, the denial rate across all EB-1 petitions (the first preference category for U.S. employment-based permanent residency) rose from 13.9% to 30.1%. These employment-based categories include highly skilled workers, researchers, physicians, entrepreneurs and others with exceptional qualifications.
In particular, the denial rate for EB-1A Extraordinary Ability petitions increased from 25.3% to 52.5%, while National Interest Waiver (EB-2 NIW) petitions also experienced a substantial increase, with denial rates rising from 37.3% to 57.4%.
Humanitarian parole applications also experienced notable increases in denial rates. Denials for humanitarian parole applications increased from 52.9% to 88.7% between FY2025 Q1 and FY2026 Q1. Denial rates also increased for parole-in-place applications, from 18.4% to 45.8%, and for advance parole applications, from 29.9% to 46.7%.
The slowdown in immigration processing extends beyond a single quarter. Comparing calendar-year averages for 2024 and 2025 reveals the same overall pattern: fewer applications received, a higher denial rate, a larger pending caseload and longer processing times. The consistency of these measures suggests that the slowdown reflects a broader shift in USCIS processing rather than normal quarter-to-quarter variation.
The council's USCIS Immigration Filing Trends dashboard will continue to track these filing and processing metrics as new data become available, providing policymakers, researchers and the public with an ongoing picture of how immigration processing at USCIS is changing.
Discover more at New India Abroad
Leave A Comment
Related









.png)
ADVERTISEMENT

ADVERTISEMENT
E Paper
Video

Comments
Start the conversation
Become a member of New India Abroad to start commenting.
Sign Up Now
Already have an account? Login